Phoenix Home Prices Up 202% Since 2001—But Not Really


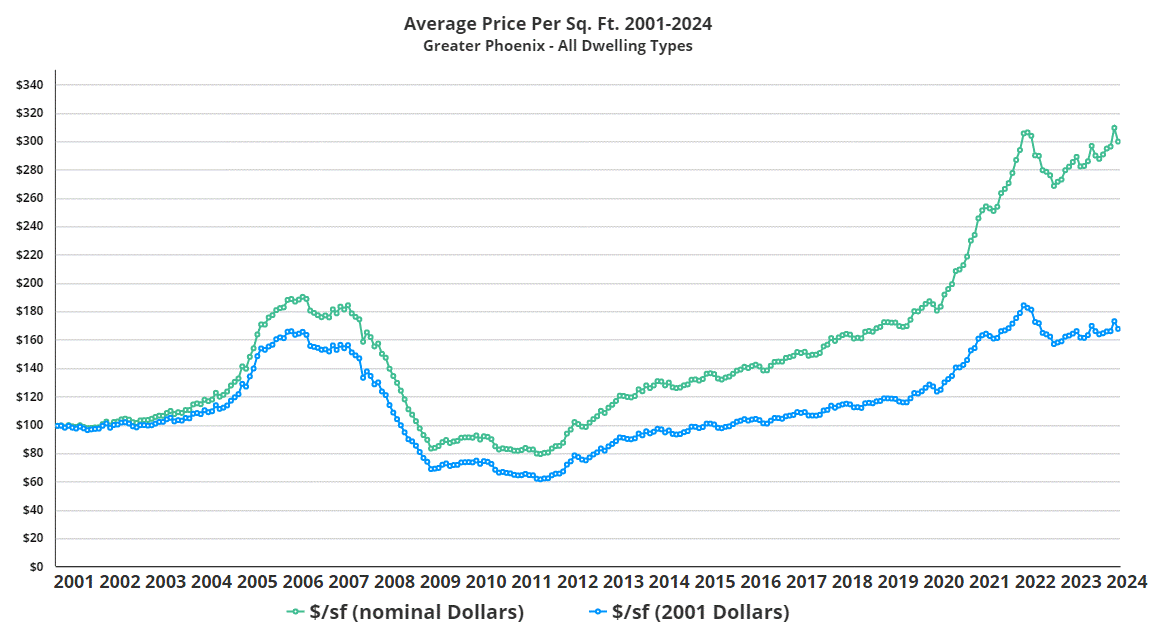
In discussing real estate prices on this market update, I primarily present figures in nominal dollars, as is common practice. However, this approach can be misleading when comparing the affordability of homes today to those from decades past. Specifically, using nominal dollars to discuss price changes over a 24-year period fails to account for the varying purchasing power of the dollar at different times. For instance, in January 2001, the average price per square foot in Greater Phoenix for all types of dwellings was $99.04. Fast forward to June 2024, and this average has escalated to $299.44. At first glance, this suggests a staggering 202% increase, indicating that prices have more than tripled. Yet, this comparison doesn’t consider the significant decrease in the dollar's purchasing power over time—a dollar in 2001 was worth 79% more than a dollar in 2024, according to the Consumer Price Index (CPI).
To provide a more accurate assessment, it's insightful to look at price adjustments made for inflation. The accompanying chart delineates the average price per square foot over time, with the nominal figures shown in green and the inflation-adjusted figures in blue. The latter are recalculated to 2001 dollars using monthly adjustments based on the CPI. This adjusted data reveals that while homes are indeed more costly in 2024 than in 2001, the real-term price increase is 69%—significantly lower than the nominal increase of 202%.
Further analysis of the real-term price data yields additional intriguing insights about the housing market's fluctuations over the years. From September 2008 to April 2015—a seven-year span—real home prices dipped below their January 2001 levels, suggesting a prolonged opportunity to purchase homes at relatively low prices. Conversely, today's real home prices, though below the peak in May 2022, align closely with those from the latter half of 2006 and late 2021. Notably, the housing market experienced two major surges, one from mid-2004 to mid-2005 and another from mid-2020 to mid-2022, both brief yet intense periods of growth. Conversely, the significant downturn from early 2007 to early 2009 marked the major bust phase, distinctively shorter in duration compared to the prolonged excess inventory phase from 2006 to 2011 that followed the first boom.
These observations illustrate the nuanced dynamics of the housing market over the last two decades. The distinction between nominal and real prices not only highlights the actual changes in housing affordability but also contextualizes the economic factors influencing these shifts. By examining these patterns, we gain a clearer understanding of the market's past trends and can better anticipate future movements.
"There are risks and costs to action. But they are far less than the long-range risks of comfortable inaction."
-John F. Kennedy
Have a great week everyone!
Recent Posts


"My job is to find and attract mastery-based agents to the office, protect the culture, and make sure everyone is happy! "
