Monday Market Update: A Two-Speed Phoenix Market
Monday Market Update · May 4, 2026
A Two-Speed Phoenix Market: Demand Holds, Prices Slip
Under-contract listings climbed 7.7% year over year while average price per square foot dropped 3.4% from last month. Luxury keeps surging. The bottom of the market keeps grinding.
Active inventory across the Phoenix metro edged up about 1.2% from last month and now sits only 1.1% below where it was a year ago, the tightest year-over-year gap we have seen in months. The seasonal supply peak appears to have already arrived, and it arrived later in the spring than it usually does. That timing is the warning. Pending sales are still up 3.1% year over year, under-contract counts are 7.7% above last year, and monthly closings finished April 5.4% above April 2025. Demand is real. It is just not evenly distributed.
Fountain Hills surged 14% to a Cromford Market Index of 164.0, Surprise jumped 11%, and Maricopa added 10%. On the other side, Queen Creek slid 10% while Paradise Valley and Cave Creek each gave back 7%. Twelve cities moved in the seller direction over the last month, six moved toward buyers. Eleven of the 18 cities sit in seller territory and seven are in buyer territory. The split itself is the headline. Sellers control the central and luxury cores. Buyers run the outer fringes and anything below the 500,000 dollar line.
By the Numbers
Monthly sales finished at 7,719, up 5.4% year over year. Both April 2025 and April 2026 had 22 working days, so the comparison is clean. The average sale price landed at $613,344, up 4.3% year over year, while the median held at $450,000, up only 1.1%. Average price per square foot dropped 3.4% from last month to $303.35, the sharpest single-month pullback in over a year. Adjusted for inflation, both the median and the per-square-foot average are slightly below where they sat 12 months ago. Luxury is still doing the lifting on the headline averages. Everything beneath it is grinding sideways.
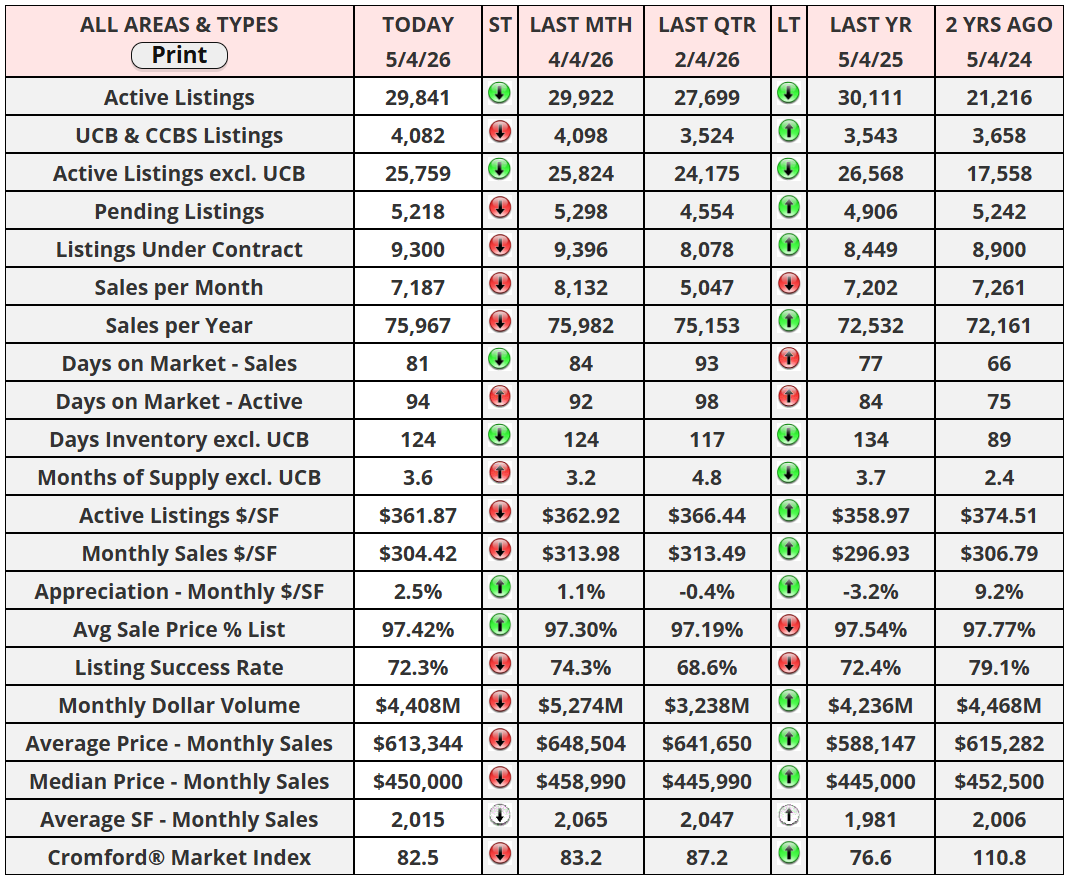
Snapshot · 5/4/26
Active Listings (excl. UCB): 25,908 (down 1.1% YoY, up 1.2% MoM)
Active Listings (incl. UCB & CCBS): 30,162 (up 0.8% YoY)
Under Contract (Pending + UCB + CCBS): 9,746 (up 7.7% YoY)
Pending Listings: 5,492 (up 3.1% YoY)
Monthly Sales: 7,719 (up 5.4% YoY)
Average Sale Price: $613,344 (up 4.3% YoY)
Median Sale Price: $450,000 (up 1.1% YoY)
Monthly $/SF: $303.35 (up 1.4% YoY, down 3.4% MoM)
Days on Market (Sales): 81 | Months Supply: 3.6
Sale-to-List: 97.4% | Cromford Market Index: 82.5
City by City
Eleven of the 18 cities we track sit in seller territory at the close of April. Seven are in buyer territory. The Cromford Market Index reads above 100 for sellers and below 100 for buyers, with 100 considered balanced.
| Rank | City | CMI | MoM Chg | Prior |
|---|---|---|---|---|
| 1 | Fountain Hills | 164.0 | ▲ 14% | 143.5 |
| 2 | Chandler | 155.3 | ▲ 1% | 154.2 |
| 3 | Tempe | 136.8 | ▲ 7% | 127.9 |
| 4 | Phoenix | 128.8 | ▲ 1% | 127.2 |
| 5 | Glendale | 124.2 | ▲ 1% | 122.9 |
| 6 | Scottsdale | 125.0 | ▲ 3% | 120.9 |
| 7 | Gilbert | 120.8 | ▼ 2% | 123.7 |
| 8 | Mesa | 120.6 | ▲ 5% | 115.2 |
| 9 | Avondale | 113.6 | ▲ 2% | 111.7 |
| 10 | Paradise Valley | 108.8 | ▼ 7% | 117.2 |
| 11 | Cave Creek | 101.2 | ▼ 7% | 108.3 |
| 12 | Peoria | 96.0 | ▼ 5% | 101.3 |
| 13 | Goodyear | 85.2 | ▲ 4% | 81.8 |
| 14 | Surprise | 77.1 | ▲ 11% | 69.2 |
| 15 | San Tan Valley | 67.4 | ▲ 3% | 65.6 |
| 16 | Maricopa | 62.9 | ▲ 10% | 57.1 |
| 17 | Queen Creek | 59.1 | ▼ 10% | 66.0 |
| 18 | Buckeye | 52.1 | ▼ 2% | 52.9 |
Source: Cromford Associates LLC, single-family detached, 18 largest cities, April 30, 2026.
What to Watch
The Fed held its target range at 3.50% to 3.75% last Wednesday, but the headline was the dissent. Four FOMC members voted against the decision, the most in any single meeting since 1992. Markets read the split two ways at once. Three members opposed the easing bias in the statement, while one wanted an immediate cut. Powell delivered what is likely his final press conference as Chair. The full Senate is expected to vote on Kevin Warsh the week of May 11, putting him in the chair for the June 16 to 17 meeting.
Futures are pricing virtually no chance of a June cut, less than 10% odds of any cut all year, and a small but rising 3.5% chance of a hike before year-end. The 30-year fixed is sitting around 6.30% to 6.39% depending on source, the 10-year Treasury is at 4.40%, and oil remains elevated on continued Iran tensions. March CPI ran at 3.3% year over year, the fastest reading since April 2024.
For Phoenix, the practical takeaway is simple. Rates are not falling fast enough to unlock the entry-level buyer, and inflation is sticky enough that the Fed has no political room to cut. The market we have now is the market we will have through summer, unless the data breaks one way or the other. Supply usually starts to ease at this point in the year, but demand also drifts lower at the end of May. Sellers should expect to keep their advantage in the central and more expensive locations, while buyers continue to control the outer fringes and the price ranges below $500,000.
See if you qualify for the renovation program
My Exclusive Renovation Offer is the only one of its kind in Phoenix. Sellers walk out with more money. Buyers walk in with more equity. Dual licensed as REALTOR and General Contractor, I do the work myself, on commission, no markups.
"Real estate cannot be lost or stolen, nor can it be carried away. Purchased with common sense, paid for in full, and managed with reasonable care, it is about the safest investment in the world."
Have a great week.
Nick Calamia is a licensed REALTOR® (CLHMS) and Licensed General Contractor (Everhome LLC, ROC 350115) with The Calamia Group at RETSY | Forbes Global Properties. Phone: (631) 617-9743. Email: nick@thecalamiagroup.com. Data sources: Cromford Report, ARMLS.
Recent Posts