Monday Market Update: The Rebalance Just Tripled in Speed

MARKET · MAY 18, 2026
Monday Market Update: Sellers Lose Ground, Faster
The pace of the rebalance just tripled. The Cromford Index fell 1.0% this week versus 0.3% last week.
The Signal
The rebalance we have been tracking through the spring just picked up speed. The average Cromford Market Index across the 17 cities we follow dropped 1.0% this week. That is three times last week's 0.3% decline. Nine cities moved in a direction favorable to buyers, eight moved in favor of sellers, and one held flat. The buyer-seller split is the same as last week, but the magnitude of the movement is what changed.
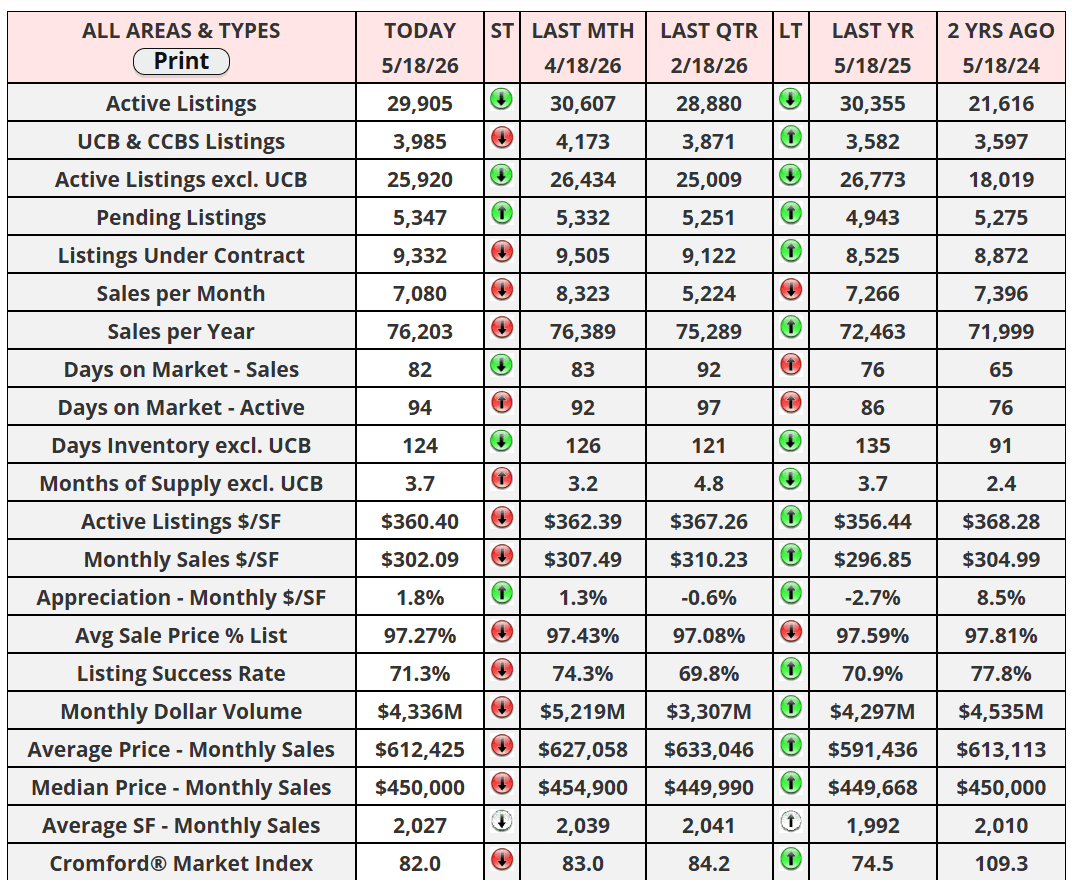
Eight cities sit in seller's market territory, four are now balanced, and six are buyer's markets. A week ago there were only two balanced markets; today there are four. Queen Creek and Paradise Valley posted the largest buyer-side moves. Surprise and Maricopa led on the seller side. The overall Cromford Index dropped from 83.0 last month to 82.0 today. Still seller-leaning by the Cromford scale, but the slope is unmistakable.
CROMFORD MARKET INDEX SPLIT
8 seller's markets · 4 balanced · 6 buyer's markets · Average CMI down 1.0% week over week
The Numbers
Active listings excluding under-contract sit at 25,920, down 3.2% from a year ago. Under contract counts moved to 9,332, up 9.5% year over year. Pending listings hit 5,347, up 8.2%. The Cromford Market Index slipped from 83.0 last month to 82.0 today. Months of supply rose from 3.2 to 3.7. Listing success rate fell to 71.3% from 74.3% last month, the sharpest single-month drop we have logged this year. Sale-to-list ratio eased to 97.27%. Average sale price moved to $612,425, up 3.5% YoY. Median sale price held at $450,000, up 0.1%. Monthly dollar volume reached $4.34B across the metro.
What This Means
The aggregate index is still seller-leaning, but the velocity has changed. Twelve weeks ago the average Cromford reading across our 17 cities was 88. Today it is 82. A 1.0% weekly drop is not panic; it is consistent erosion. When listing success rate falls 3 points in a month while months of supply climbs 0.5, the seller leverage that defined March is no longer evenly distributed.
The story underneath the average is geographic. Paradise Valley fell 7% in a single week and is now barely above 100. Queen Creek dropped 12% and remains the weakest market we track. Scottsdale and Tempe each gained 2% and keep absorbing demand. Phoenix proper is flat. The metro is not moving in one direction. It is splintering.
What to Watch
April's CPI landed Tuesday at 3.8% year over year, up from 3.3% in March and hotter than most analysts forecasted. Bond yields responded immediately. The 10-year Treasury climbed to 4.60% by Friday, a multi-month high. The 30-year fixed mortgage rate now sits at 6.46%. A few economists are openly modeling that May's CPI could top 4%, the first reading above that line since May 2023. Higher rates here means thinner demand into the back half of spring.
The Iran ceasefire that pulled rates lower in April is fragile again. A reported break in talks sent crude up roughly 8% off the recent low this week. Energy-driven inflation is the single biggest external pressure on Phoenix housing this quarter. The Fed has no meeting until June. Between now and then the May CPI release on June 10 is the next major data point. If it confirms a second consecutive hot print, the higher-for-longer scenario locks in.
"Buy when others are despondent and sell when others are euphoric."
HETTY GREEN
Recent Posts